

Please note that this article reflects my personal best guess about clinic quality based on public HFEA data. Ultimately, the success rates aren’t everything but they are hopefully a good starting point for choosing a clinic. Success rates are partly random and different clinics might serve patients with different characteristics which would influence success rates regardless of the underlying clinic quality. Comparisons within the same age band should somewhat reduce this bias but cannot fully eliminate it.
I emailed all seven clinics featured more prominently in the article with a list of questions and gave them a chance to give me accurate first-hand information. Only King’s Fertility and Care Fertility London got back to me.
After our egg freezing article came out in Works in Progress in April, I got a lot of questions about which fertility clinics in London are the best. And since you have to write a blog post if at least three people ask you exactly the same question, here is a blog post!
Headline success rates
I started by scraping HFEA data on clinic success rates since their website makes it quite hard to get an overview of all clinics that you want to compare. Some clinics have too few cycles in a given category so they won’t actually show any data. This means that they won’t be in my analysis at all1.
As laid out in our additional guide, the three most important metrics are success rates per embryo transfer, success rates per egg collection, and egg survival rate. We have success rates per embryo transfer and success rates per egg collection available from the HFEA website. They further split this in under-38 and over-38 year old patients. From those four metric-age combinations, I get all clinics that are above average2 on at least two metrics.
No single clinic manages to be significantly above average for all four metrics. There are five clinics across the UK that manage to be significantly above average across three metrics, two of those in London:
ARGC (London)
CRGH Portland (London)
Care Fertility Sheffield
Edinburgh Fertility Centre
TFP GCRM Fertility
There are a further ten clinics that are above average on two metrics, four of those in London:
Harley Street Fertility Clinic (London)
The Evewell West London
Care Fertility Nottingham
TFP Belfast Fertility
Care Fertility Northampton
Care Fertility London
Hewitt Fertility Centre
TFP Oxford Fertility
Bristol Centre for Reproductive Medicine
King’s Fertility (London)
I focus my analysis on the London clinics since those are the ones that I get asked about the most. I also add the London Women’s Clinic (LWC) to my list since they run the London Egg Bank so they probably do a lot of egg freezing cycles in young women and might have particularly good expertise in that area.
The seven clinics that I’m focusing on comparing are thus ARGC, CRGH, Harley Street, Evewell, Care, LWC and King’s3.
Here is a plot of the four success metrics for those clinics. The dark grey ribbon is where we would expect 95% of clinics to fall if their true success rate was equal to the national average and we randomly drew the number of cycles that they performed. When the clinics are outside that band, I thus assume that they are actually better than the national average rather than this just having happened by chance.
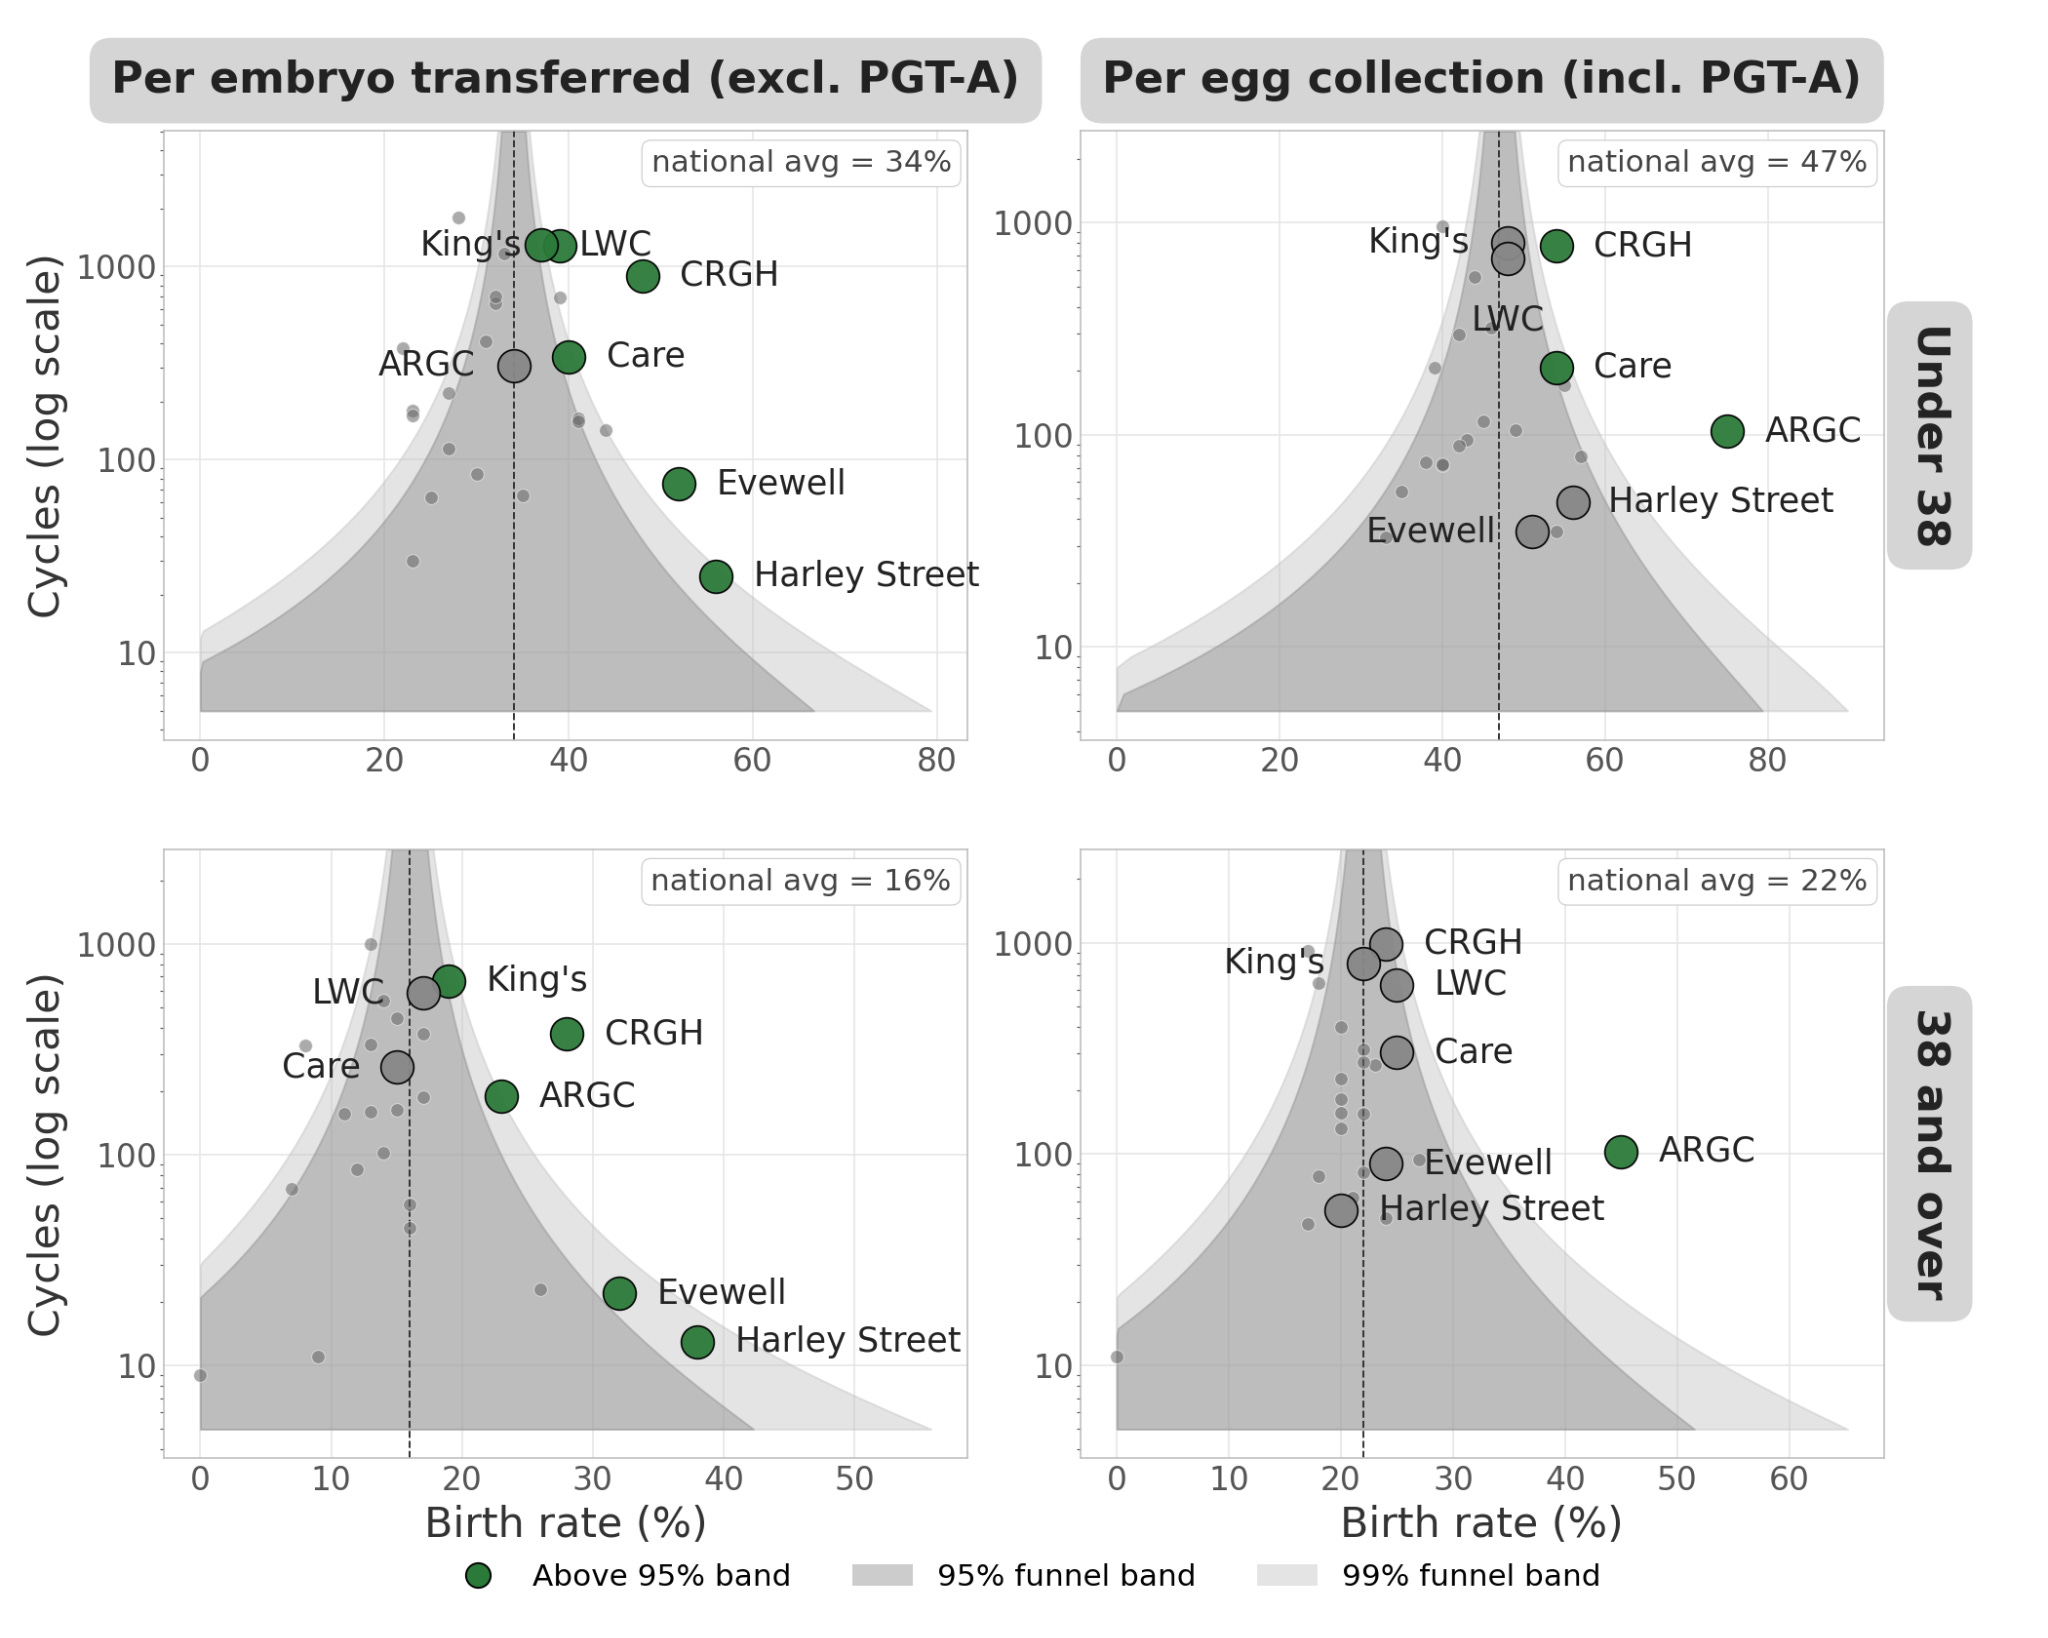
Based on these success metrics, ARGC and CRGH Portland are the two standouts, with above average rates on 3 out of 4 metrics for both of them.
Remember that the success rate per embryo transferred only captures the final step of the process whereas the success rate per egg collection is a more comprehensive metric of the entire process. On the other hand, the success rate per egg collection is more easily biased by patient characteristics since some women just have lower ovarian reserves that might not lead to many eggs/embryos even with the best stimulation possible.
CRGH Portland is a clear outlier on both metrics for under-38s. ARGC is a very strong outlier on success rates per egg collection but totally average for success rates per embryo transferred. This could reflect a less selective approach to embryo transfer where lower quality embryos are transferred more often.
Further statistics
After this initial filter, I look at the further statistics from HFEA to get a more complete picture. Here, we can compare finer age bands, distinguish between fresh and frozen embryo transfers, and look at more up to date data since they have pregnancy rates for 2024! It also allows us to compare success rates per embryo transferred vs. per embryo transfer. While clinical guidance states that single embryo transfer is the first choice, clinics might sometimes transfer more than one embryo at once. If a clinic routinely transfers multiple embryos rather than doing single embryo transfer, we would thus be able to spot a bigger difference between the success rate per embryo transfer and per embryo transferred.
I first focus on the under-35 pregnancy rates per embryo transfer and per embryo transferred, once for 2022-2023 and once for 2024:
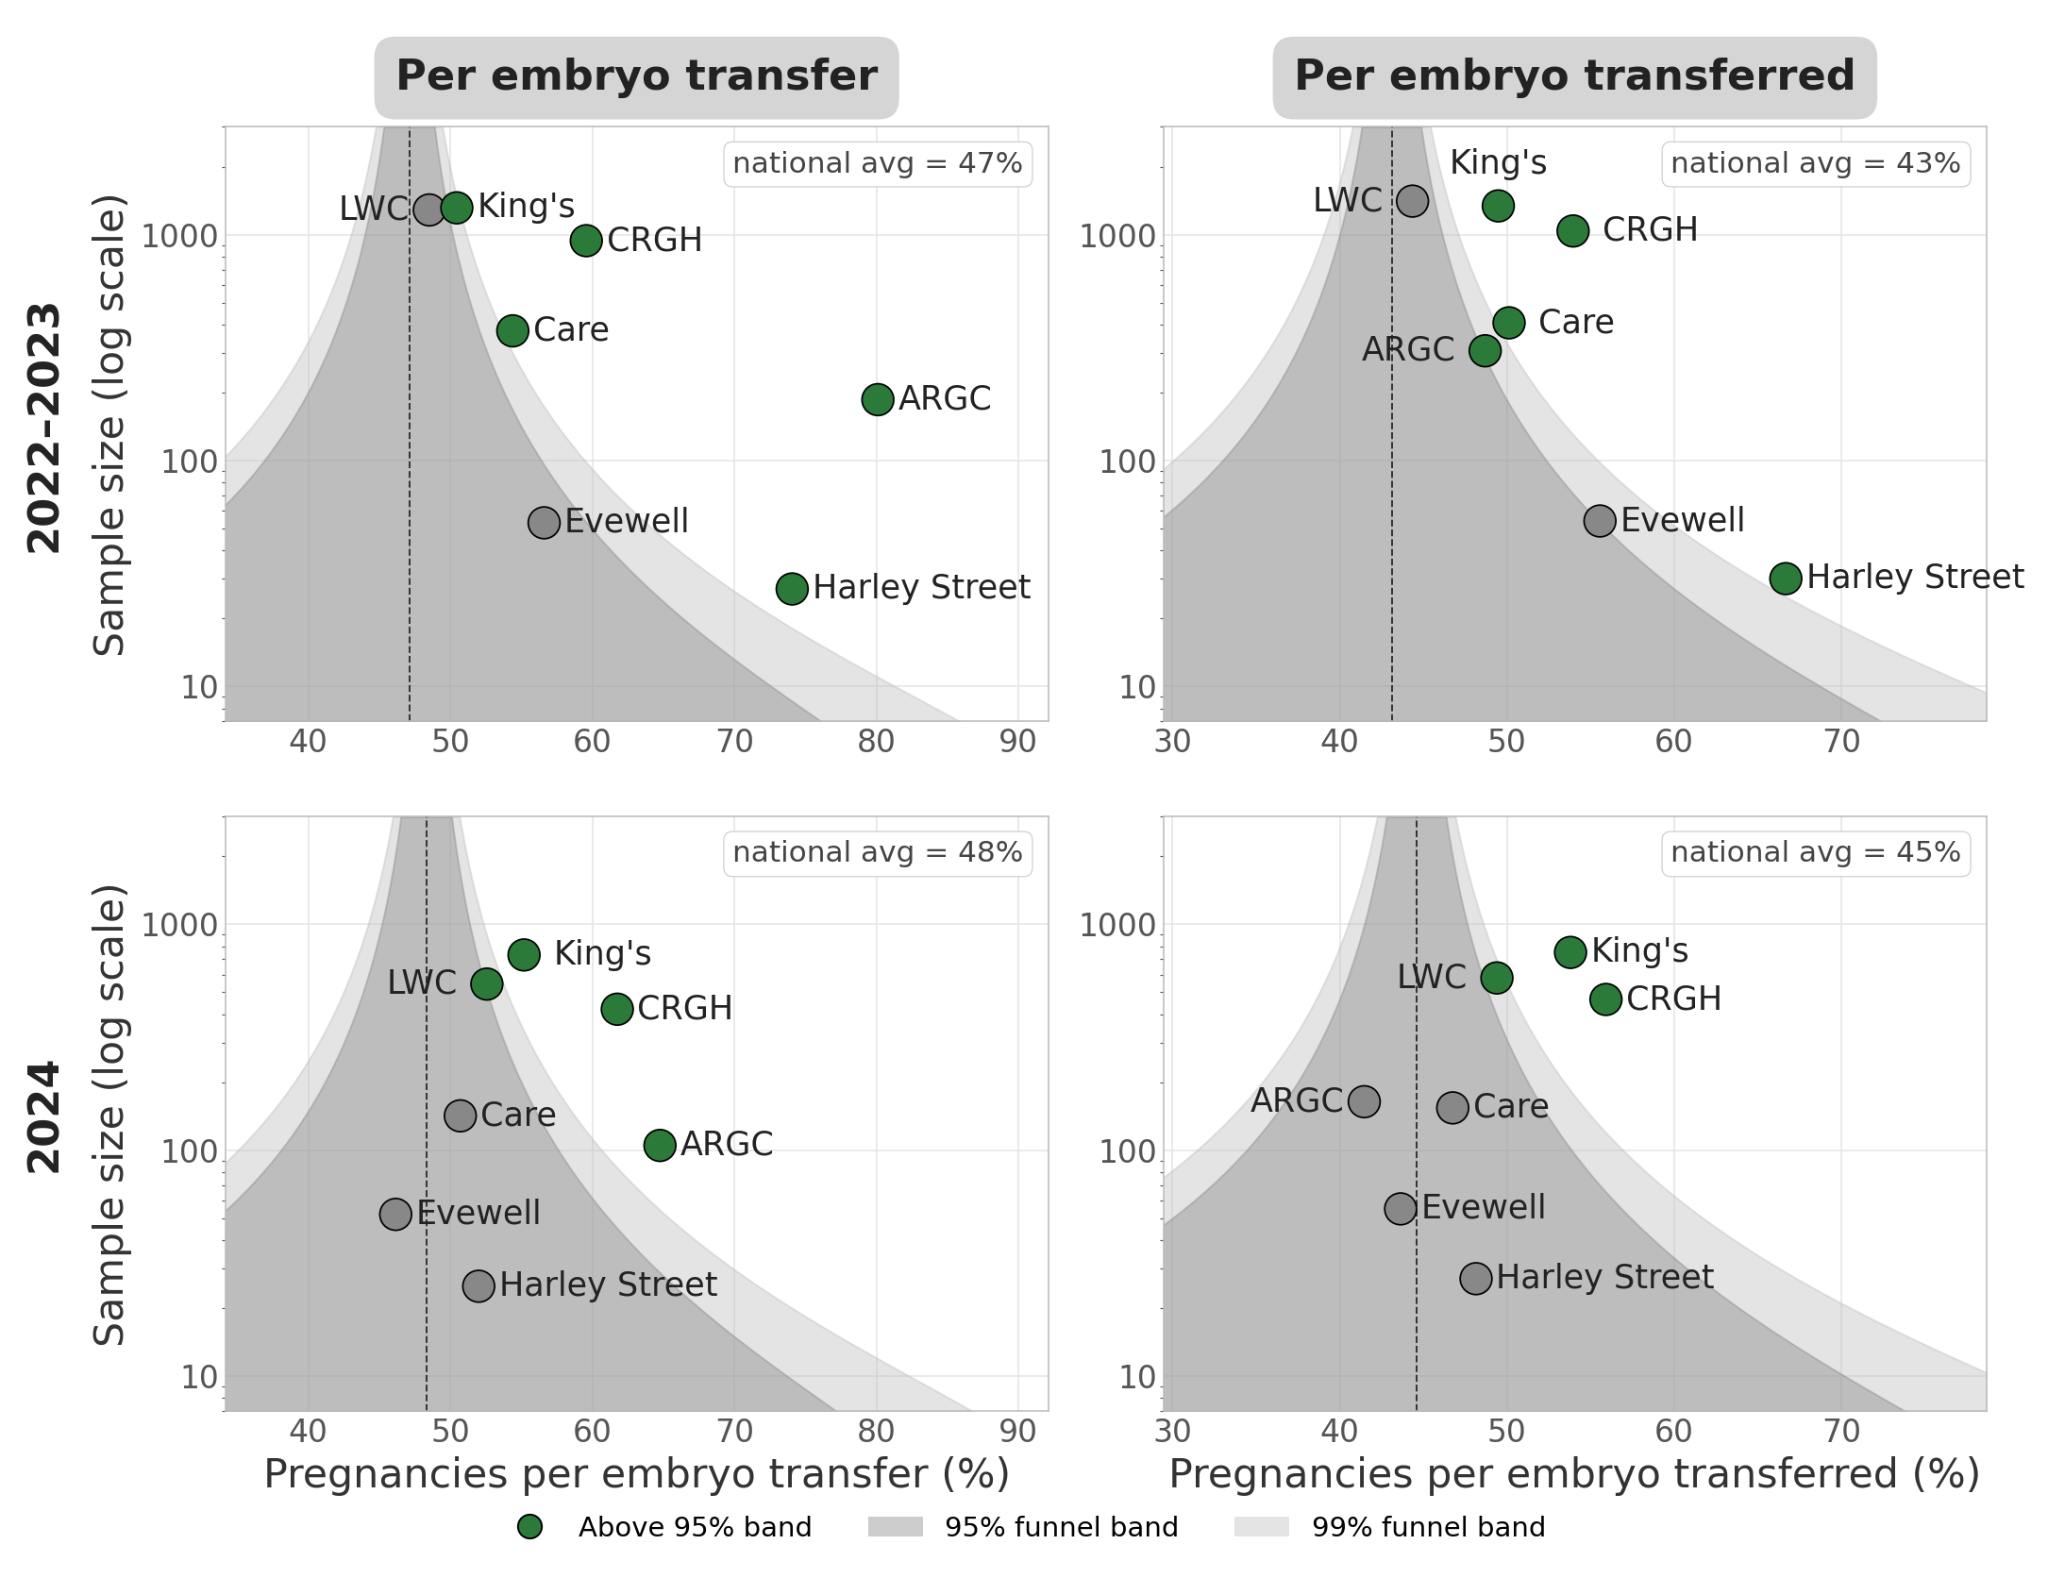
Most clinics show similar success rates when comparing per embryo transfer with per embryo transferred, indicating that most clinics have a very high rate of single embryo transfers. Only ARGC shows quite big shifts between the two metrics which means that they likely have quite high rates of transferring multiple embryos per transfer, inflating their per transfer success rate.
Comparing the 2024 to the 2022-2023 data, we see that King’s and CRGH Portland are particularly stable, achieving above average rates in both time periods.
To make sure that we’re not just picking up random variation in the under-35 group, I also compare clinics more comprehensively across age bands:
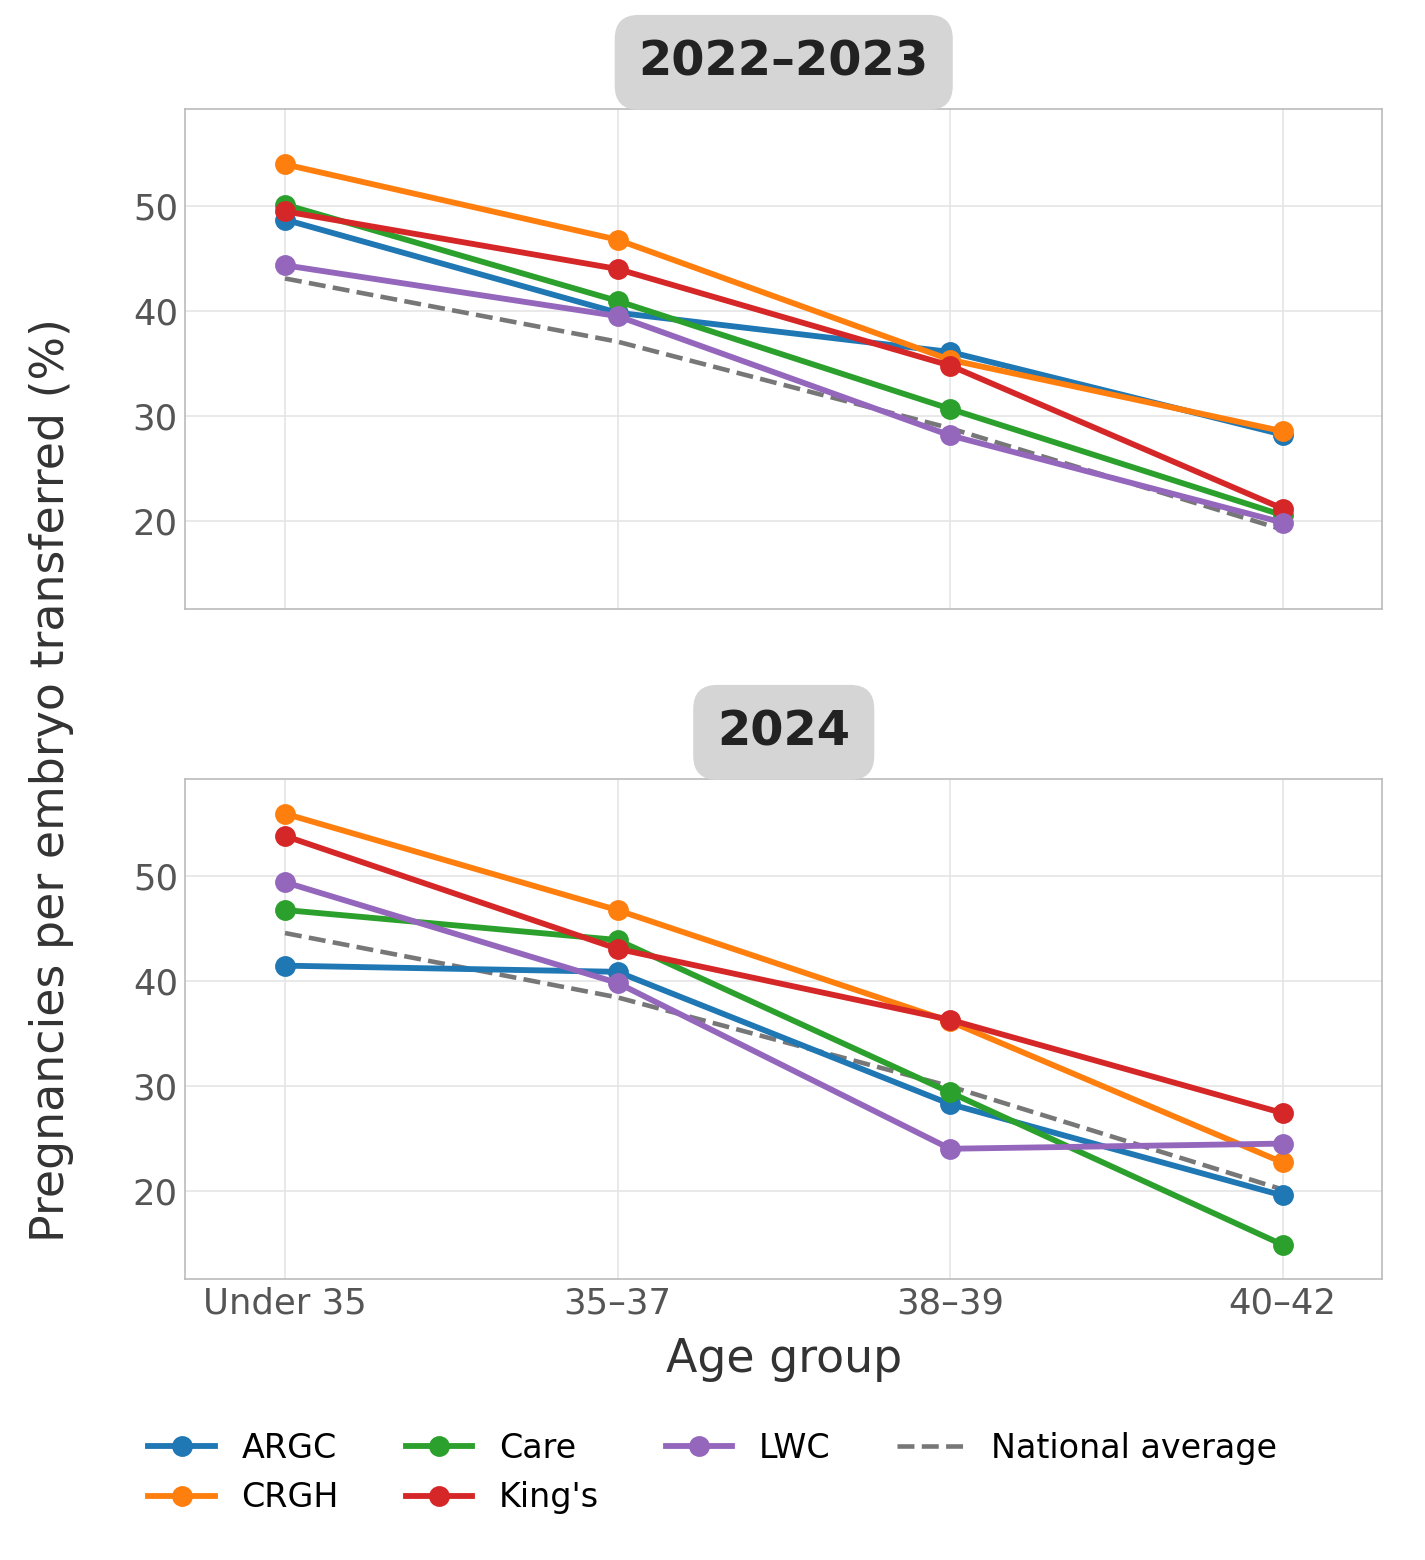
Here, I’m showing only 5 of the clinics because Harley Street and Evewell have small volumes and become very noisy when splitting them further. I’m focusing on pregnancies per embryo transferred as the comparison metric. In general, it looks like clinic rankings are somewhat stable across age bands and between the two years, indicating that our success rate comparisons are picking up some real underlying quality differences rather than just random noise. CRGH and King’s are the two clinics that most consistently come out on top as before.
I also inspect the multiple birth rate next as a further point of comparison between the clinics.
Multiple birth rate
Here we see that all of our chosen clinics are within the expected band around the national average, except ARGC which is a strong outlier for the multiple birth rate, especially for the under 38s.
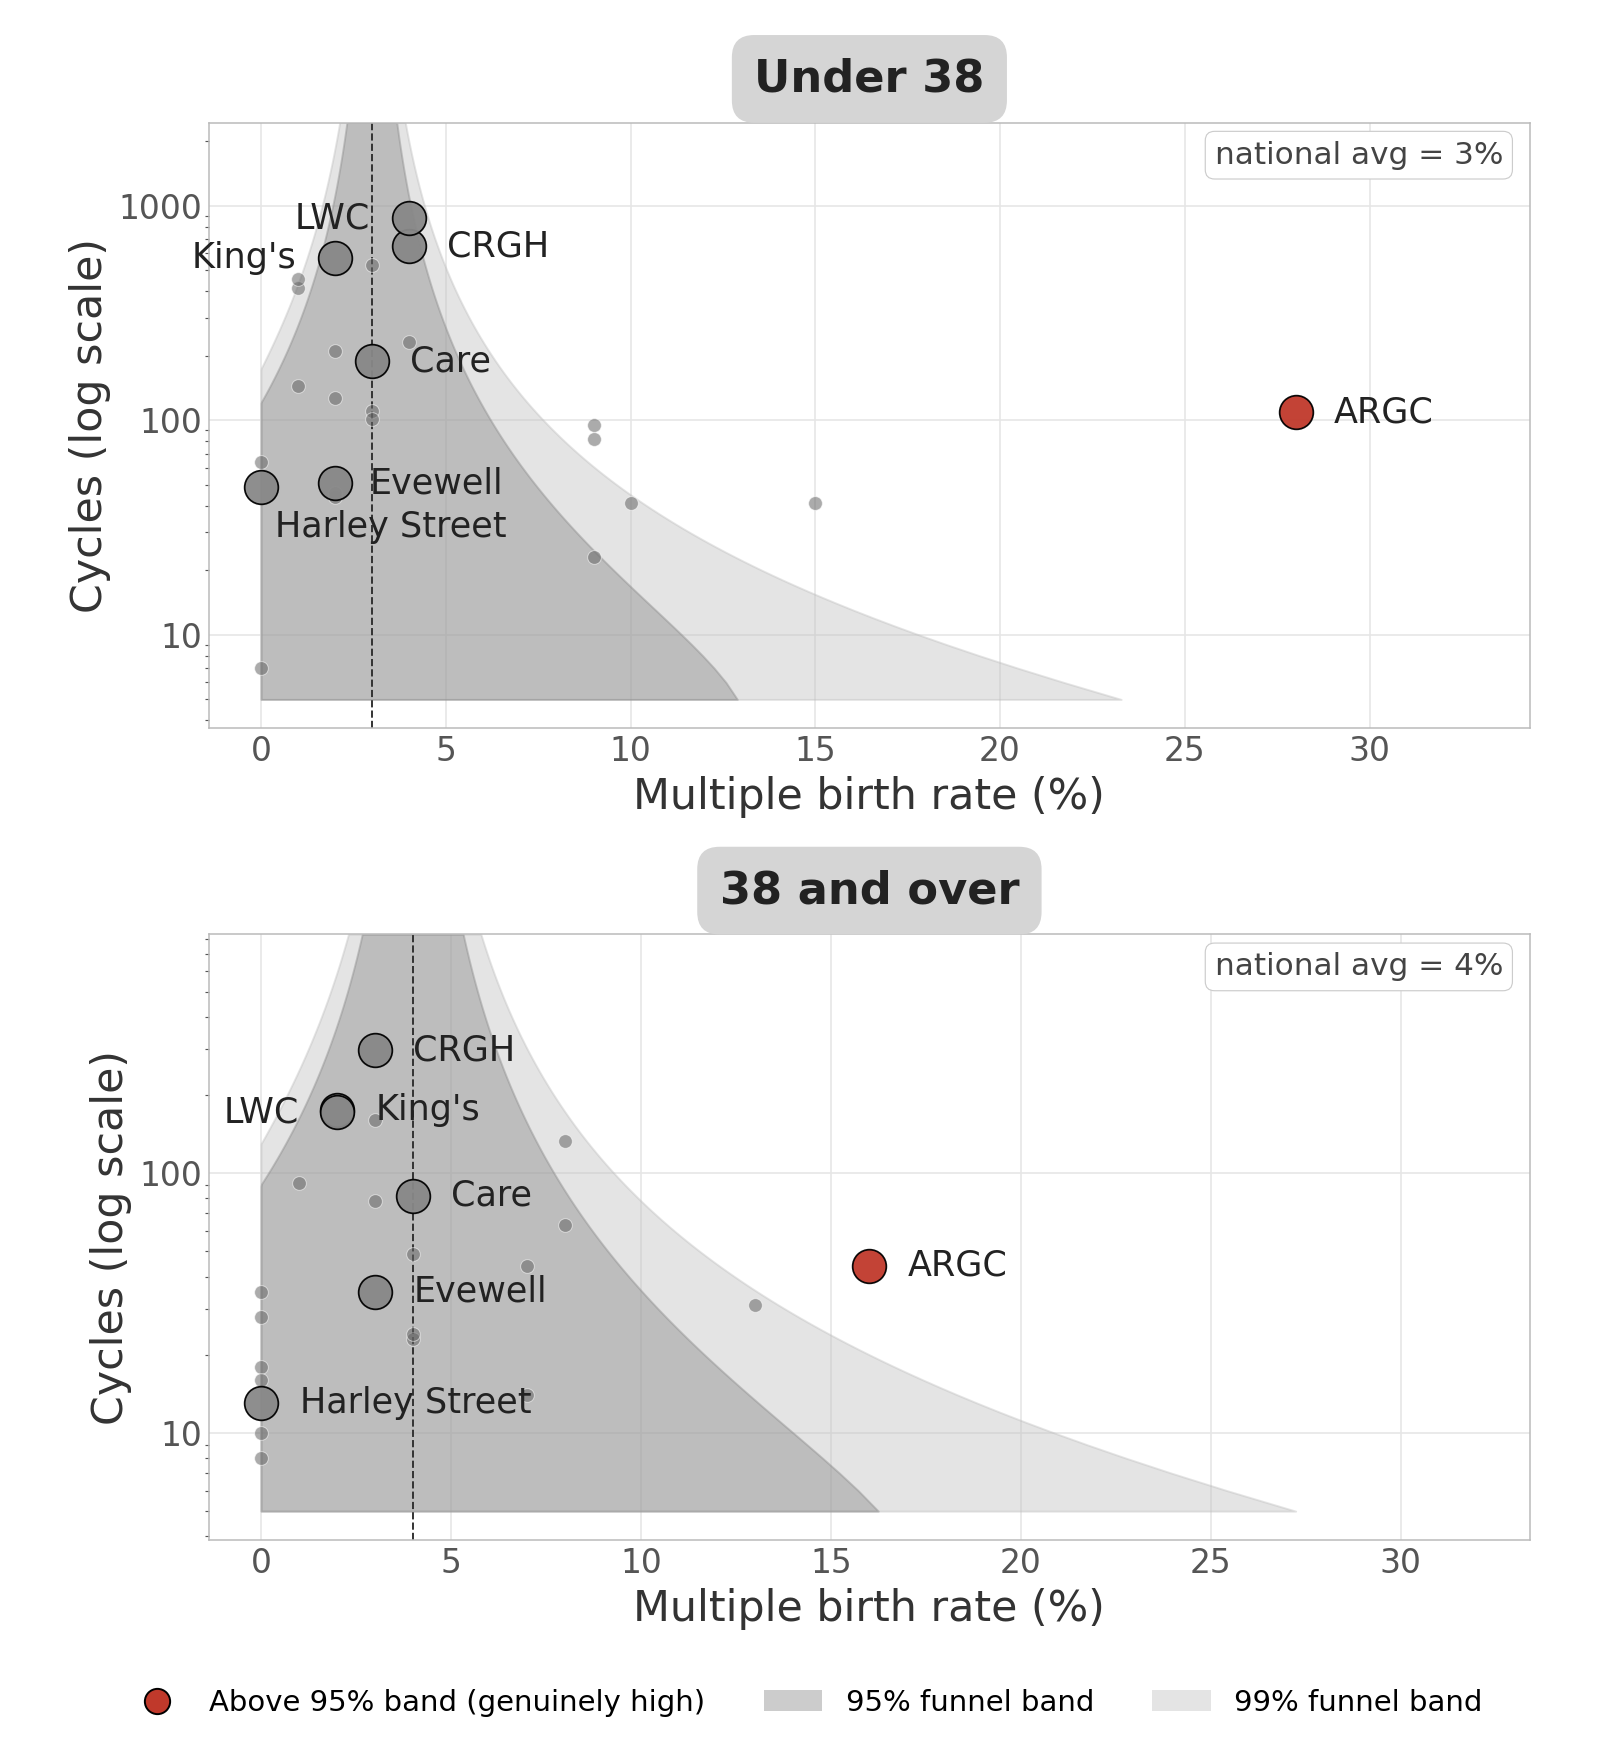
This confirms what we found when comparing success rates per embryo transferred and per embryo transfer: ARGC must have a much higher rate of multiple embryo transfers, trading off the higher success rates with the higher risks associated with multiple pregnancies. At the same time, the other clinics manage to have above average success rates without this trade-off and have an average level of multiple birth rates.
Pricing
I also tried to get an overview of prices at the different clinics. I’m unfortunately not very confident in this since pricing is notoriously intransparent and there are differences in how clinics report their prices. I think it’s still useful to give an overview based on what I was able to find. The clinics don’t differ wildly so at least it should give a good sense of what the total price will roughly be regardless of where you go.
I try to calculate the “all-in” cost for two cycles since young women doing egg freezing are likely to be able to freeze the recommended 20 eggs in two cycles. The all-in cost includes the cycle fees, first-year storage, initial consultation, pre-treatment screening, infectious disease screening, monitoring scans and bloods during the cycle, and 2 x £1,500 for medication. The medication cost will depend on the medication dose that you’re getting so there is quite a bit of individual variation here4. It looks like clinics might also charge different amounts for the same medication even though these are usually procured through external pharmacies. I also note the cost per further year of storage since this can matter quite a bit if you’re planning to freeze young and store the eggs for a longer time period.
King’s and Care were the only clinics that got back to me about their pricing so I’m more confident that I’m getting them right. King’s estimates their medication costs at £1,000-1,200 per cycle so if this is correct, then it might be up to £1,000 lower than what I’m estimating for the all-in cost.
Based on the information that I could find, the all-in cost for two cycles should be between £10,000 and £12,500. This also lines up well with what I paid all-in for two cycles in Oxford two years ago which was around £10,000.
The one that I’m most unsure about is CRGH since their own estimate of ~£7,700-£8,300 per cycle would mean that the cost for two cycles should be around £15,000 which is a lot more than what I estimate based on the posted prices. If their estimate is correct, then that would make them by far the most expensive clinic based on the data that I could find. LWC gives a range for the all-in cost which adds up to ~£11,500-£14,500 for two cycles. My own estimate is close to the lower end of the range but at the upper end, LWC would also be one of the most expensive clinics.
Some clinics offer discounts for three cycles or packages that guarantee at least 20 frozen eggs so it can make sense to look into that as well. For example, Care Fertility has a package for up to four egg collection cycles or up until 20 eggs are frozen. This costs £7,995 and includes storage for the first two years. With the initial consultation for £575 and medication costs for two cycles of £3,000, it would thus cost around £11,570 and therefore less than paying for two cycles separately. LWC has an option where you pay £14,000 for everything but get your money back if you retrieve fewer than 20 eggs across 4 cycles. Both clinics have eligibility criteria for these options, i.e. you need to be young enough and have a high enough AMH.
Research activity
One other consideration that I thought might be important is how actively the different clinics are participating in research. I would guess that the more research active the clinicians are, the more likely they are to be aware of frontier techniques and the more willing to implement them.
In order to get an overview of this, I made Claude Opus 4.8 identify the clinicians working at each of the seven clinics and then search the relevant databases for any papers that they might have published. For each paper, it checked whether the paper was about an IVF-related topic. I restrict the search to 2021-2026.
I count the number of clinicians at each clinic5, the number with at least one relevant paper and with at least three relevant papers, and the total number of papers by all clinicians. As a summary measure, I calculate the total number of papers normalised by the number of clinicians to account for the fact that some clinics are simply much bigger than others.
As an additional analysis, I also count the number of papers that appeared under the clinic banner in 2021-2026. Some clinics belong to bigger groups that operate multiple clinics across the country so it might matter if research is produced by the clinic group but not directly by the clinicians at the location that we’re focusing on.
Overall, LWC, CRGH, and King’s stand out as the research-intense clinics based on their current clinicians’ research activity. King’s is affiliated with King’s College London and CRGH has close ties with University College London.
The number of papers published under the whole clinic group banner largely confirms this result, with Care standing out as the one clinic that has substantial research activity in the whole clinic group while none of its current London clinicians do.
Comparison with IVI Valencia
According to Ruxandra, IVI Valencia is probably the best egg freezing clinic in Europe. How do the top London clinics stack up against that?
Unfortunately, the Spanish data is reported in a slightly different way: They only publish coarse bands for the number of cycles and they give the success rates as a range that is supposed to reflect the uncertainty based on different patient characteristics.
Otherwise, the numbers should be comparable, especially for fresh embryo transfers. Frozen embryos might be PGT-A tested at IVI Valencia whereas the HFEA data excludes PGT-A tested embryos from its success rates.
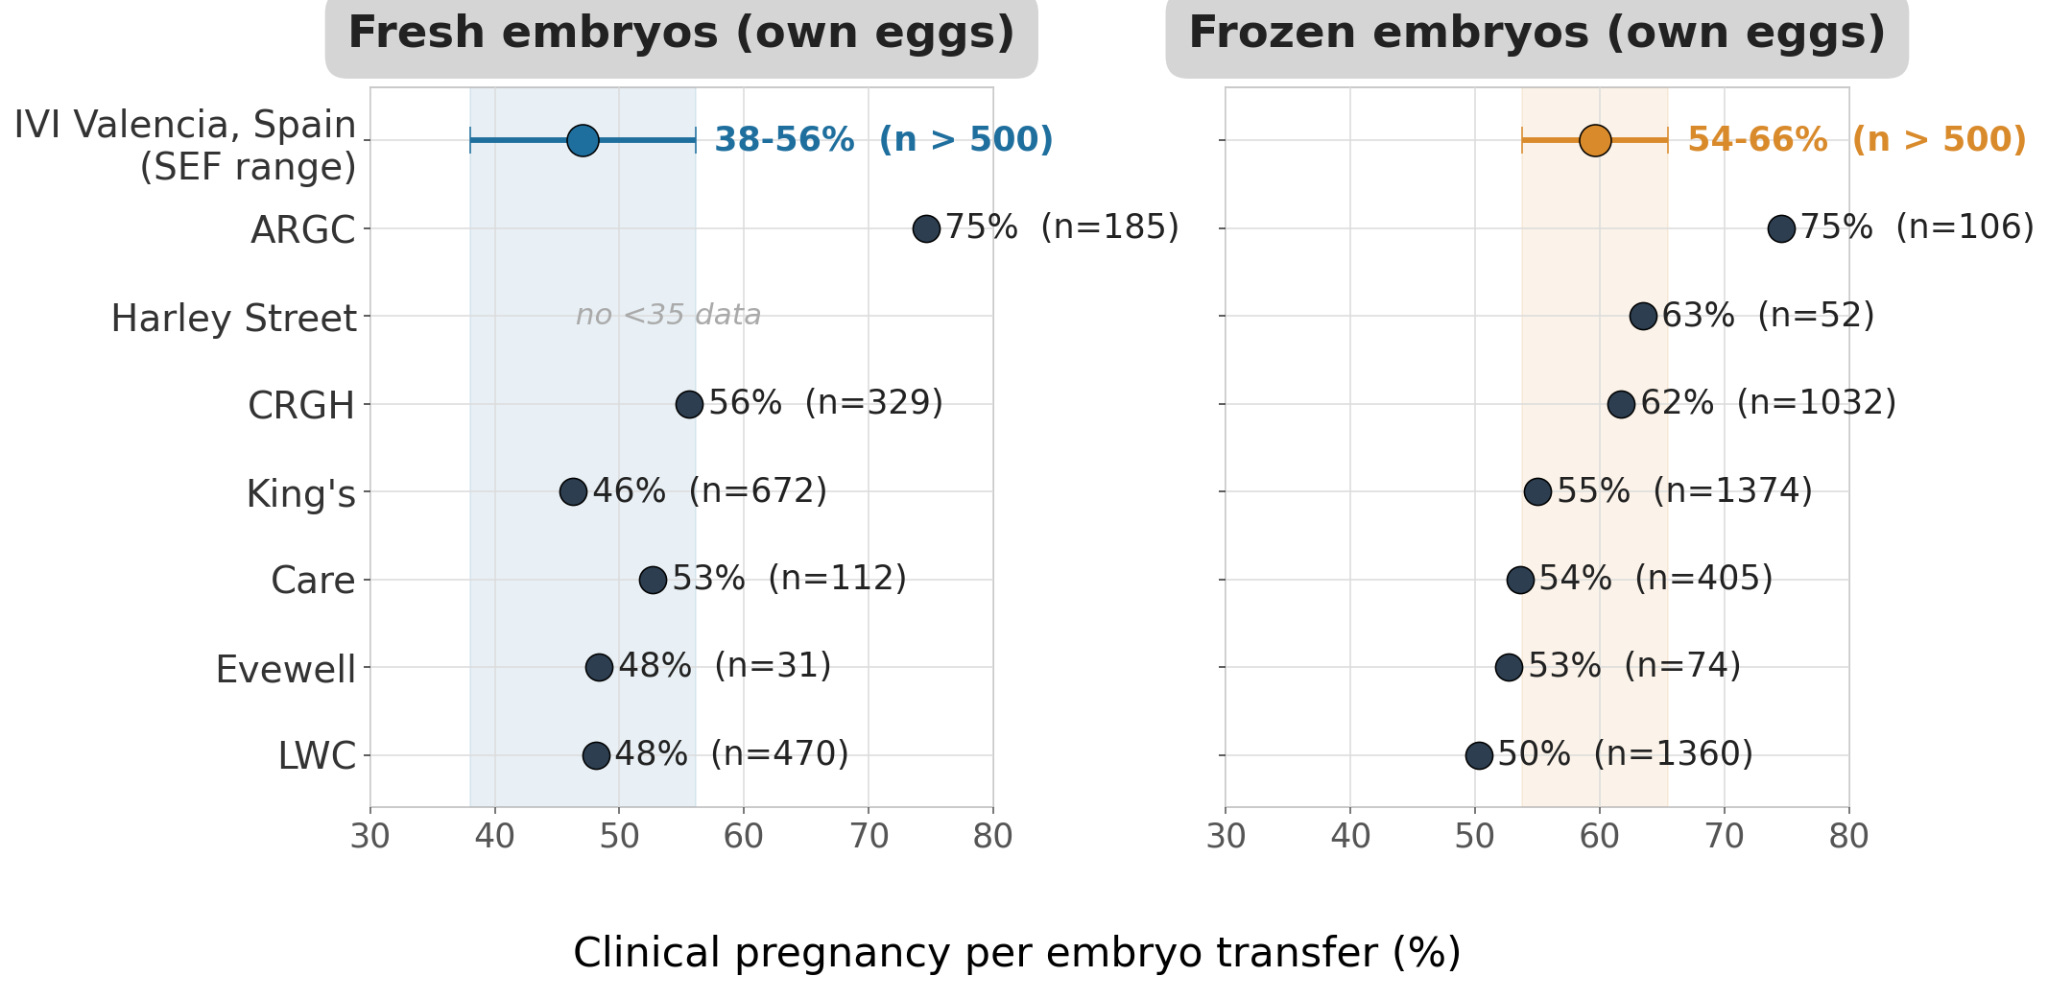
We can see that for fresh embryo transfers, the UK clinics all fall within the range of success rates at IVI Valencia, with ARGC surpassing it. CRGH is right at the top of IVI’s range. For frozen embryos, most of the clinics are clustered towards the bottom of IVI’s range or even slightly below. However, CRGH Portland is close to the top of the range with a high number of cycles and ARGC manages to surpass it, albeit with a lower number of cycles and with the caveat that their rate per embryo transfer is inflated due to higher numbers of multiple embryo transfers. Keep in mind that IVI Valencia also has an advantage in the comparison of frozen embryos because this will include PGT-A tested embryos that lead to pregnancy at higher rates regardless of underlying skill of the clinic.
In general, my take-away from this is that the best clinics in London are roughly on par with IVI Valencia when it comes to IVF success rates.
Frozen egg survival
The HFEA doesn’t track one of the most important metrics when it comes to egg freezing: The survival rate of frozen eggs once they are thawed again. Eggs are less stable than embryos and don’t survive the thawing process at higher rates. However, if a clinic uses the best modern vitrification methods, then it should be able to achieve very high egg thaw survival rates. IVI Valencia says that they achieve close to 97% survival upon thaw in patients under 35 and their survival rates have also been tested in peer-reviewed studies.
I contacted the seven clinics and asked them about their egg survival rates. King’s and Care were the only two clinics that got back to me. King’s latest internal data shows that they are now achieving 98% thaw survival for eggs that were frozen and thawed in their clinic while Care reports 99% survival rate.
With the caveat that we don’t have standardised data here, this is more evidence that the best clinics in London are on par with IVI Valencia.
Overall recommendation
I would personally tend towards the four bigger clinics, King’s, CRGH, London Women’s Clinic, and Care Fertility since they have more experience and their above average success rates are more meaningful. I’m slightly wary of ARGC because of the high multiple birth rate.
London Women’s clinic runs the London Egg Bank and might be the place to go if you want to “freeze & share”, i.e. donate half of your eggs but pay nothing for the egg freezing.
King’s and CRGH have the most robust above average success rates and also the highest research activity which means that they might be better at actually using techniques at the research frontier. The downside with CRGH might be that they are potentially much more expensive. If going with them, I would inquire very carefully about the total price. An additional point in favour of King’s is that their thaw survival rates seem to be very high. Personally, I will probably go for King’s or CRGH if I end up wanting to use my frozen eggs.
Another limitation is that it’s a bit arbitrary which clinics get listed as separate clinics with their own stats rather than pooling different locations of the same clinic group together. It depends on which licence each physical location operates under and I don’t attempt to consolidate different clinic locations together. Some clinics also have “satellite clinics” that don’t provide the full range of services. For example, you might do the monitoring scans at the satellite clinic while the final egg collection is done in the main clinic. London Women's Clinic's HFEA figures are reported under a single licence that pools its Harley Street site with affiliated clinics in Bristol, Cambridge, Brighton, Kent and elsewhere. Its separately licensed sites (Bromley, Darlington, Cardiff) are excluded. The other six clinics report either figures from a single site (CRGH Portland, ARGC, Evewell West London, Harley Street) or only pool smaller London outposts into their numbers (King's, Care Fertility London).
By above average, I mean that they fall outside the 95% band that we would expect them to fall in by chance if their true underlying success rate was equal to the national average.
These are the shorter names that I’m using throughout but keep in mind that the stats apply specifically to CRGH Portland, Evewell West London, and Care Fertility London, not to other sites of the same clinic.
This is usually based on your AMH: If your AMH is lower, you get a higher dose of stimulation medication, if your AMH is higher, you get a lower dose of stimulation medication. I use £1,500 based on the different ranges that different clinics give. This is potentially more on the conservative side for young women doing elective egg freezing so your costs might be lower.
For Evewell, I can’t identify which clinicians are at Evewell West London specifically rather than at the Evewell in general.
Thank you so much for this write up. I also scraped the data from HFEA, with some generous radius around London ie excluding far-away clinics.
I then asked Claude Opus 4.8 to calculate the correlation between the success metrics. The correlation is so low that I wonder if it would be a mistake to try and optimise for these metrics - I infer from the low correlation that, rather than indicating a 'general factor' of clinic competence, the success rates might not be much better than random, at which point you should use different signals to choose clinics, such as the surgeon's relevant experience level (especially, as in my case, when I'm looking to get an operation done that doesn't map to either of the metrics, namely a surgery on me, and I'm not female).
Does that seem like a fair inference to you? NB I do not know how correlations are calculated.
From Claude:
The two metrics are only weakly correlated:
┌────────────────┬───────┐
│ Measure │ Value │
├────────────────┼───────┤
│ Pearson r │ 0.28 │
├────────────────┼───────┤
│ R² │ 0.08 │
├────────────────┼───────┤
│ Paired clinics │ 26 │
└────────────────┴───────┘
Plain-English answer: if a clinic scores well on births per embryo transferred, that tells you very little about how it scores on births per egg collection. The correlation is positive but weak — knowing one metric explains only about 8% of the variation in the other. The remaining ~92% is driven by something else.
★ Insight ─────────────────────────────────────
- Why these two diverge: "per embryo transferred" measures what happens after an embryo is in place, while "per egg collection" folds in everything upstream — how many eggs fertilise, how many become viable embryos, lab quality, freezing strategy. A clinic can be great at one stage and mediocre at another, which is exactly why the correlation is low.
- R² vs r: R² (0.08) is the more honest "predictive power" number here — it's literally the fraction of variance in one metric explained by the other. The eye-catching r=0.28 sounds less trivial than the 8% it really represents.
- Small-n caveat: with only 26 paired clinics, an r of 0.28 is not statistically significant (the ~95% threshold for n=26 is around r≈0.39), so the safest reading is "no reliable linear relationship detected."
─────────────────────────────────────────────────
Thank you for writing this Luzia! I imagine it will be of help and use to many.